Contents
- 1 Understanding Noise Figure in Amplifiers

Source: YouTube
Understanding Noise Figure in Amplifiers
Introduction to Noise Figure
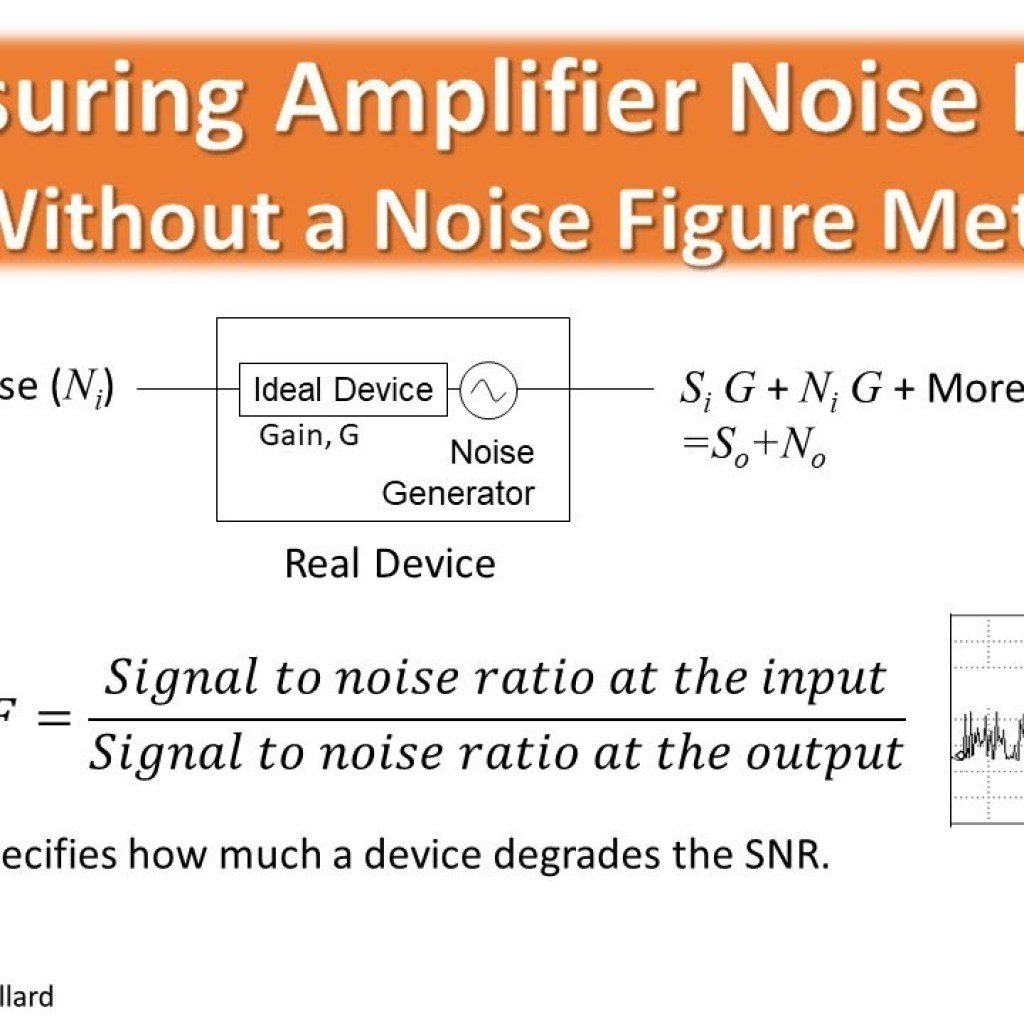
The concept of noise figure is crucial in understanding the performance of both electronic and optical amplifiers. It quantifies the additional noise introduced by an amplifier to a signal. The noise figure is expressed in decibels (dB) and is derived from the noise factor, which is the ratio of the output noise power to the input noise power, adjusted for the amplifier’s gain.
Noise Factor and Standard Noise Levels
The noise factor measures the degradation of the signal-to-noise ratio (SNR) as a signal passes through an amplifier. It is essential to consider the standard noise level when calculating the noise factor:
- Optical Amplifiers: The standard noise level is shot noise, a fundamental aspect of quantum noise, which limits the performance of optical amplifiers.
- Electronic Amplifiers: The standard noise level is thermal noise at room temperature, as thermal noise is the primary limiting factor in electronic systems.
Calculating the Noise Figure
The noise figure (NF) is calculated as ten times the logarithm (base 10) of the noise factor. A hypothetical amplifier with no added noise would have a noise factor of 1, resulting in a noise figure of 0 dB. Any additional noise introduced by the amplifier is termed excess noise.
Amplifier Stages and Friis’s Formula
When dealing with amplifiers composed of multiple stages, the noise factor of the overall system can be determined using Friis’s formula. This formula takes into account the gain and noise factor of each stage. Notably, the noise contribution of later stages becomes less significant if the first stage has a high gain, as the amplified signal dominates the input noise of subsequent stages.
Noise Figure in Optical Amplifiers
In optical amplifiers, particularly phase-insensitive ones like fiber amplifiers and semiconductor optical amplifiers, quantum noise significantly influences the noise figure. In the high-gain limit, the noise factor must be at least 2, corresponding to a noise figure of at least 3 dB. This limit applies regardless of the amplification mechanism, whether it involves stimulated emission or nonlinear interactions.
Factors Affecting Noise Figure
Several factors can affect the noise figure of optical amplifiers:
- Amplified Spontaneous Emission (ASE): In four-level laser amplifiers, ASE is the primary noise mechanism.
- Raman Amplifiers: These can also achieve the fundamental noise limit under ideal conditions.
- Losses: Excess losses, especially near the amplifier input, can degrade the noise performance.
Phase-Sensitive Amplifiers
Noise figures below 3 dB are achievable with phase-sensitive amplifiers, such as those based on degenerate parametric amplification. These amplifiers manage noise differently, often increasing noise in one quadrature component while reducing it in another.
Application in Optical Fiber Communications
Noise figure is a critical parameter in optical fiber communications, affecting the performance of erbium-doped fiber amplifiers, fiber Raman amplifiers, and semiconductor optical amplifiers. The design details, such as pump light direction and parasitic losses, significantly influence the noise figure. For instance, backward pumping in quasi-three-level amplifiers can result in higher noise figures due to reduced excitation at the signal input end.
Conclusion
Understanding noise figure is essential for optimizing amplifier performance in both electronic and optical domains. By minimizing excess noise and carefully designing amplifier stages, it is possible to enhance signal quality and improve communication systems’ efficiency.

Source: Test & Measurement Tips
Feel free to comment your thoughts.


