Contents

Source: iZotope
<>
The Concept of Spectrograms in Optics
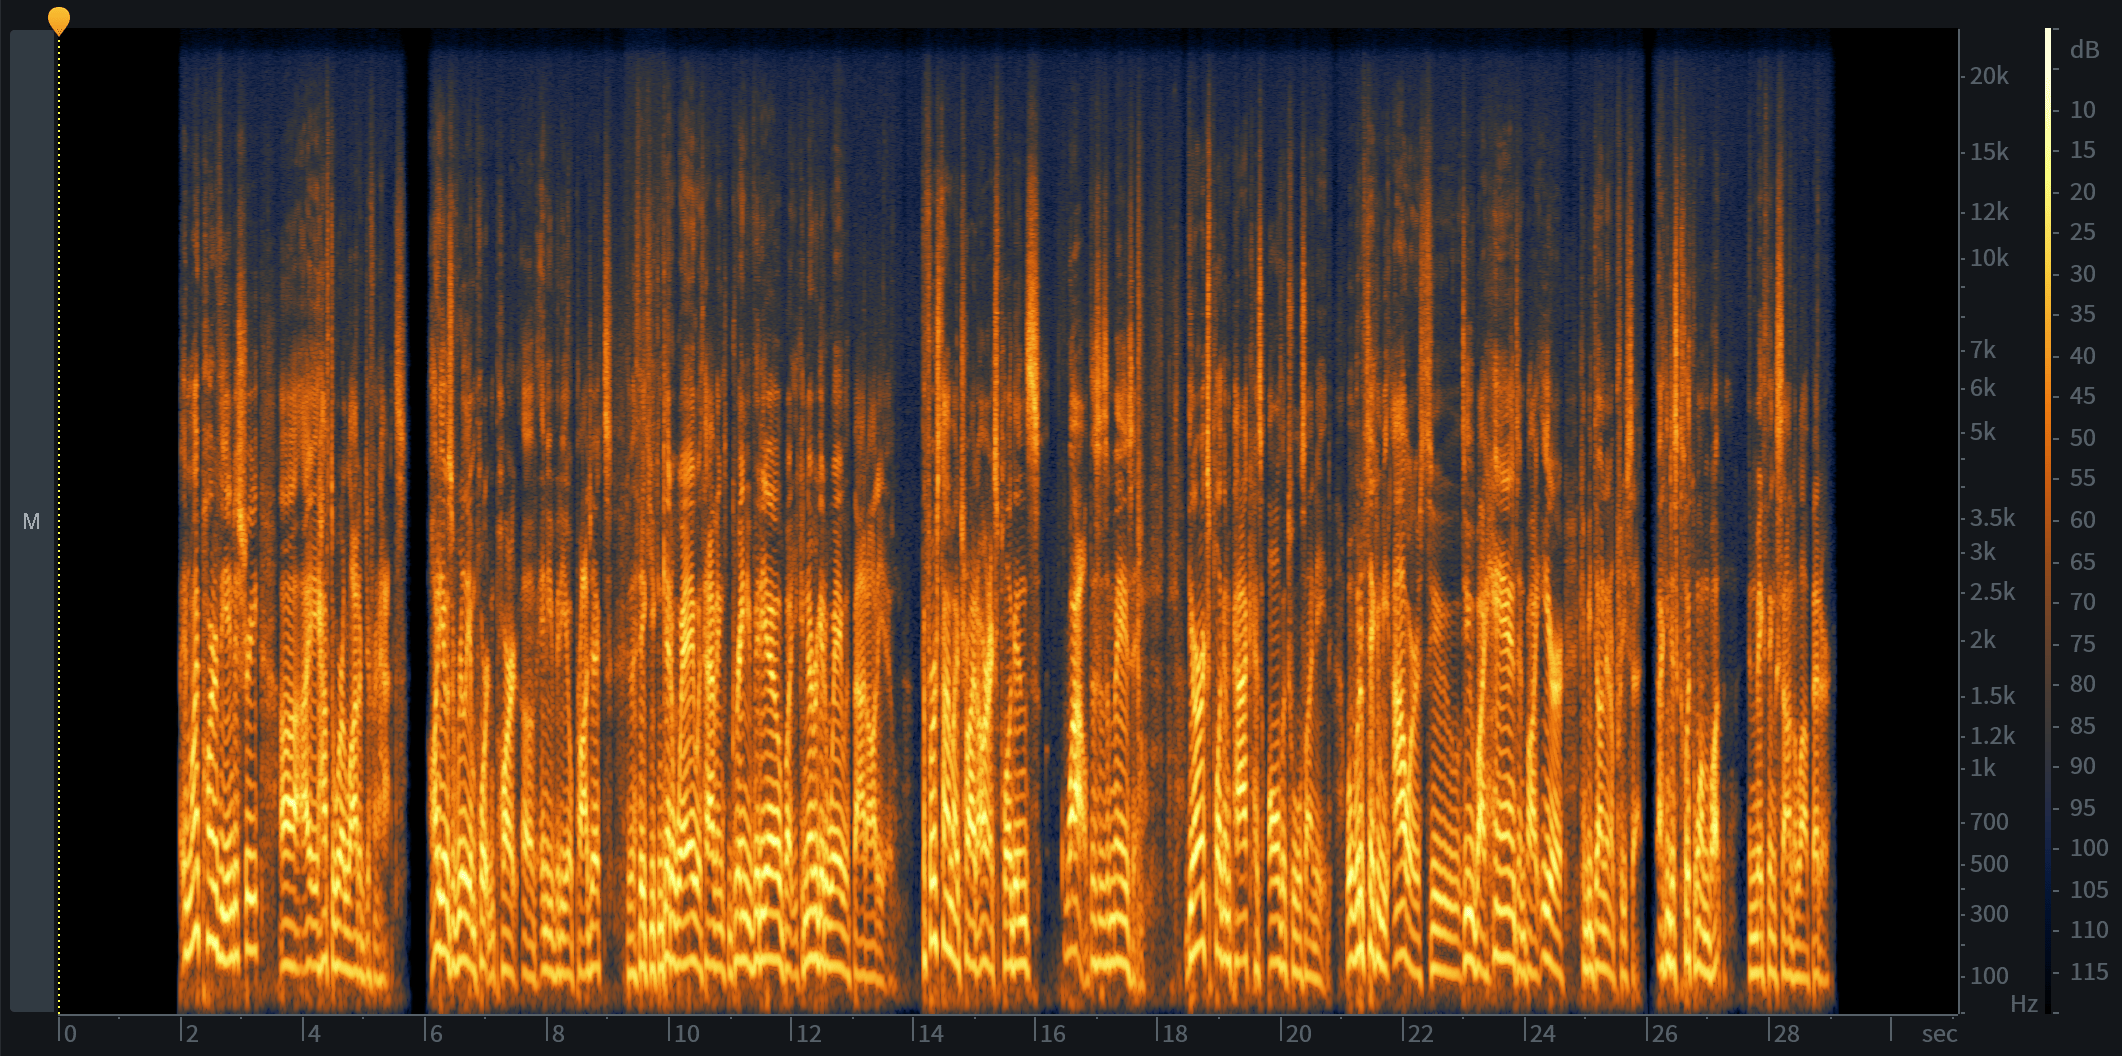
Spectrograms are a common tool in acoustics and are also utilized in optics, particularly in the realm of ultrashort pulses. The fundamental idea behind spectrograms is to represent a time-dependent spectrum by applying a Fourier transform to different temporal segments of a signal.
Mathematical Representation
In mathematical terms, a spectrogram is represented by the equation $S(omega ,t) = {left| {intlimits_{ – infty }^{ + infty } {E(tau ) : g(tau – t) : e^{iomega tau} ; rm{d}tau } } right|^2}$, where $E(tau)$ is the signal being analyzed (e.g., the electric field of a pulse), and $g(tau – t)$ is a gate function, often taking the form of a Gaussian. The choice of gate function width significantly impacts the temporal and spectral resolution of the spectrogram.
Visualization and Interpretation
Typically, spectrograms use a horizontal time axis and a vertical frequency (or wavelength) axis. The intensity at each time-frequency combination is represented using a gray or color scale. This visualization method is intuitive, especially for features like chirped ultrashort pulses.
Complex Behavior in Spectrograms
Higher-order solitons exhibit intricate behavior in spectrograms. As seen in animated spectrograms, solitons can experience both up- and down-chirps during pulse evolution in a fiber. Additionally, phenomena like soliton fission and supercontinuum generation result in complex spectrogram patterns.
Chromatic Dispersion and Spectrogram Features
Chromatic dispersion in fibers influences spectrogram characteristics. For instance, in supercontinuum generation, different frequency components experience varying time delays due to dispersion effects. The resulting spectrogram may show soliton pulses, unconverted light from the initial pulse, and background noise correlated with nonlinear processes.
Conclusion
Spectrograms provide valuable insights into the temporal and spectral characteristics of optical signals, offering a visual representation of complex phenomena like pulse evolution and supercontinuum generation.

Source: LANDR Blog
Feel free to comment your thoughts.


